4QFY2018 Result Update | HFC
May 10, 2018
Dewan Housing Finance Ltd
BUY
CMP
`625
Performance Highlights
Target Price
`740
Particulars (` cr)
4QFY18
3QFY18
% chg (qoq)
4QFY17
% chg (yoy)
Investment Period
12 Months
NII
667
626
7
536
25
Pre-prov. profit
610
562
9
459
33
PAT
313
306
2
249
26
Stock Info
Source: Company, Angel Research
Sector
HFC
Dewan Housing Finance (DHFL) posted an impressive operating performance yet
Market Cap (` cr)
19,580
again in 4QFY18. The HFC’s business grew in the quarter with a 28% yoy rise in
Beta
2.3
loan book to `91,932 cr. In line with it, AUMs also increased by 33%yoy in the
52 Week High / Low
680.6/387.2
quarter. At the bottom line, the company’s net profit grew by 26%, aided by steady
Avg. Daily Volume
4,40,992
growth of 25% in net interest income, a surge of 70% in other income and a
Face Value (`)
10
BSE Sensex
35,216
reduction in cost with respect to income, which decreased by 120 bps to 25.4%.
Nifty
10,718
Asset quality intact even when advances surge
Reuters Code
DWNH.NS
Bloomberg Code
DEWH.IN
During 4QFY18, the company’s AUM grew by 23%, 57%, 42% and 61% in home
loans, LAP, corporate loan and SME loans, respectively. Aggressive growth is
witnessed in LAP as the interest rate is higher than that of home loans. This
Shareholding Pattern (%)
increasing concentration on LAP helps the NIM to be at 3% even with competitive
Promoters
39.2
rise in total loans and other assets. Off balance sheet, AUM stood at 17% of total
MF / Banks / Indian Fls
9.5
AUM as of 4QFY18. The company’s loan book also increased simultaneously. On
FII / NRIs / OCBs
20.5
yoy basis, disbursements and sanctions spiked by 85% and 81%, respectively.
Indian Public / Others
16.3
Added to this, borrowings increased by 11.3%, while the cost of funds was almost
same. The mix in borrowing remained largely unchanged with banks accounting
for 42% of total borrowings, followed by capital markets (40%) and others (18%).
Abs. (%)
3m 1yr
3yr
Even when the loans and advances soar, DHFL is careful about its asset quality.
Sensex
2.0
17.0
30.0
The company maintains an excellent asset quality with GNPA at 1% of the
DHFL
9.4
102.7
153.3
advances and NNPA at 0.5% at the end of 4QFY18. The company increased
provisions by 57%yoy and 30%qoq.
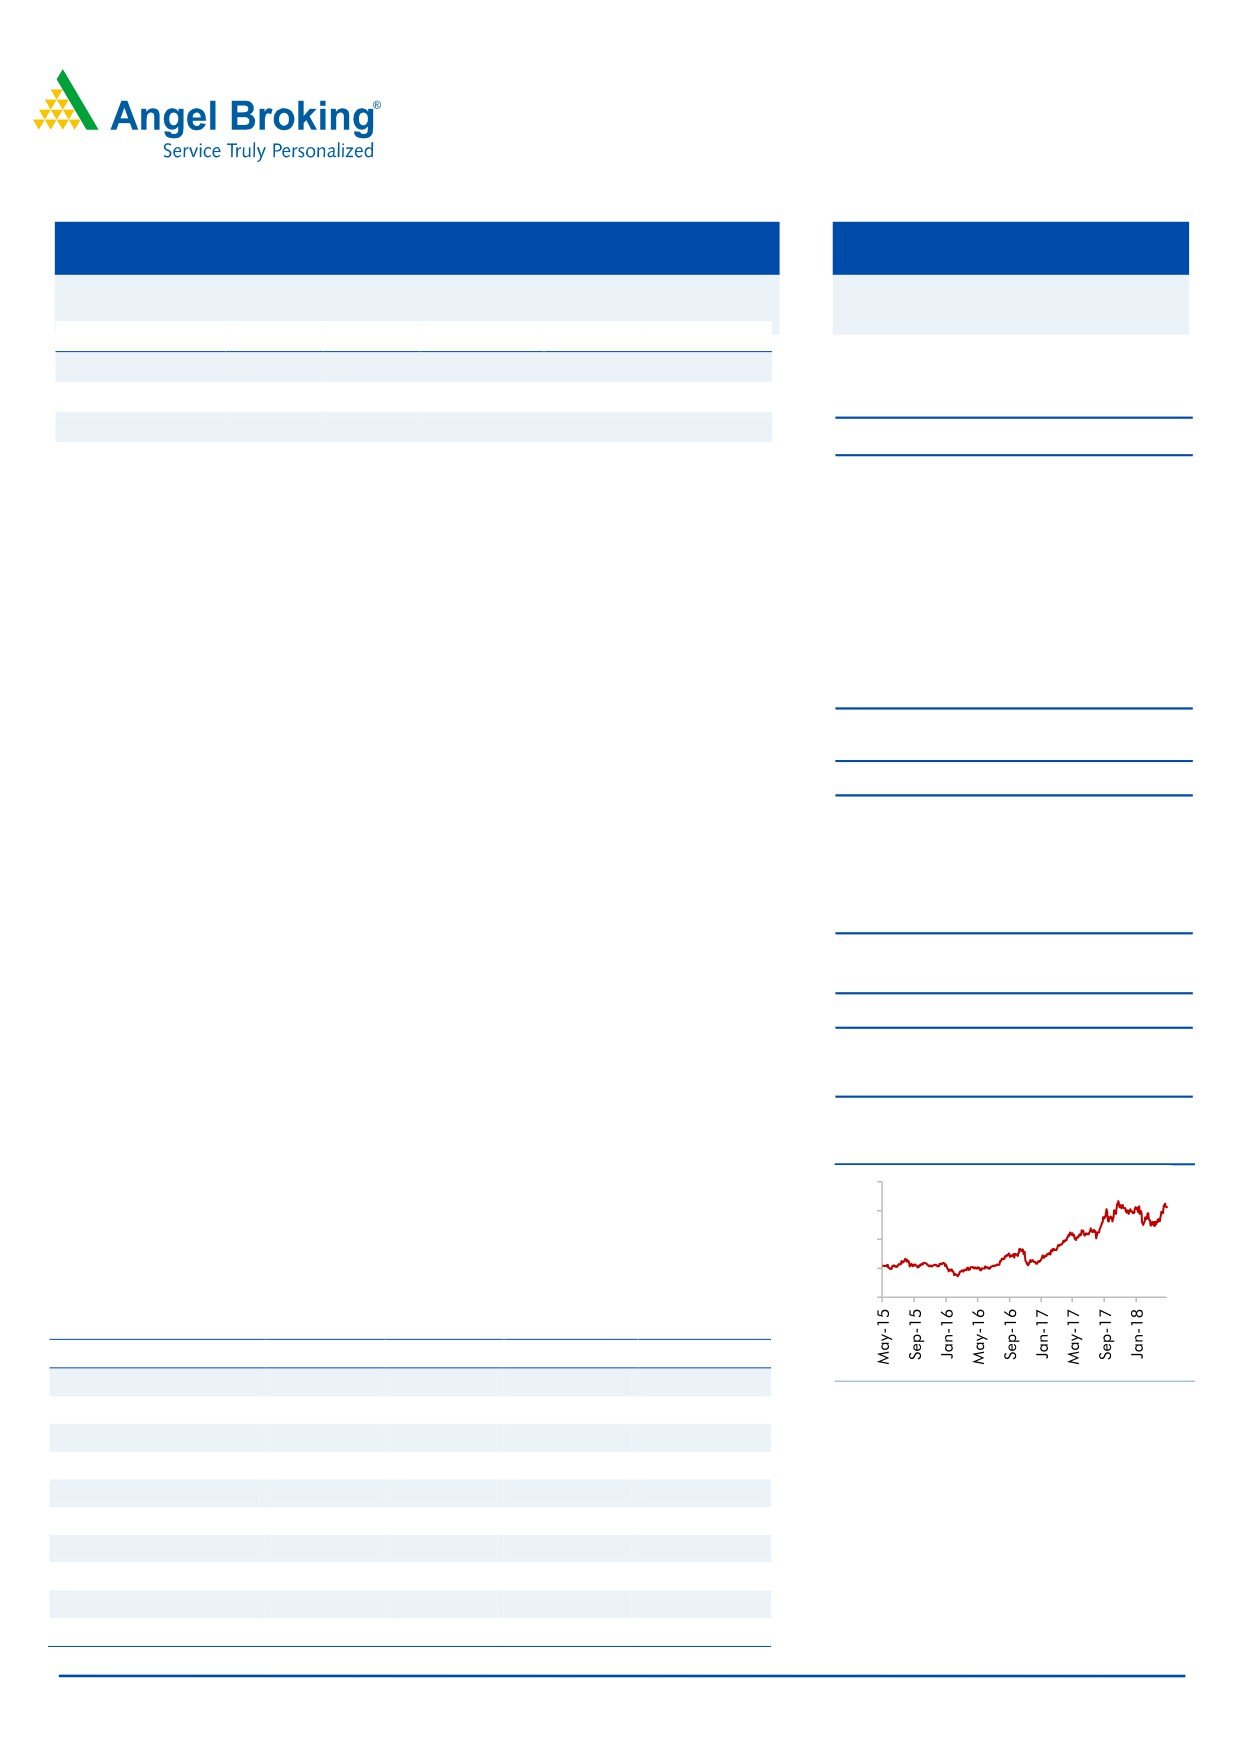
3-year price chart
Outlook & Valuation: We expect the company to post a healthy loan book CAGR
800
of 28.5% over FY2017-20E, which is likely to translate in earnings CAGR of 28%,
600
over the same period. At the current level, the stock is valued at 1.8x FY2020E
400
ABV. We maintain BUY on the stock, and retain our target price of `740.
200
0
Key financials (Standalone)
Y/E March (` cr)
FY2017
FY2018E
FY2019E
FY2012E
NII
1,859
2,460
3,114
3,789
Source: Company, Angel Research
% chg
25.5
32.4
26.6
21.7
Net profit
927
1,174
1,565
1,931
% chg
27.1
26.7
33.2
23.4
NIM (%)
2.3
2.5
2.6
2.5
EPS (`)
29.6
37.4
49.9
61.6
P/E (x)
21.3
16.8
12.6
10.2
P/ABV (x)
2.5
2.3
2.1
1.8
Jaikishan Parmar
022 - 39357600 Ext: 6810
RoA (%)
1.3
1.3
1.4
1.4
[email protected]
RoE (%)
14.4
14.0
16.6
17.8
Source: Company, Angel Research; Note: CMP as of May 10, 2018
Please refer to important disclosures at the end of this report
1
DHFL | Q4FY2018 Result Update
Exhibit 1: Quarterly update
Y/E March ('cr)
4QFY18
3QFY18
%qoq
4QFY17
%yoy
FY18
FY17
%chg
Interest Income
2647
2520
5
2283
16
10024
8512
18%
Interest Expenses
1980
1894
5
1747
13
7564
6654
14%
Net Interest Income
667
626
7
536
25
2460
1859
32%
Fees and Other Income
161
114
41
95
69
441
345
28%
Total Income
828
740
12
631
31
2901
2204
32%
Operating Expenses
218
178
22
172
27
722
583
24%
Employee
100
89
13
66
53
357
262
36%
Others
118
89
32
106
11
338
297
14%
Operating Profits
610
562
9
459
33
2179
1620
34%
Provisions
130
100
30
83
57
420
218
93%
PBT
480
462
4
376
28
1759
1402
25%
Taxes
167
156
7
127
31
584
475
23%
PAT
313
306
2
249
26
1174
927
27%
Source: Company
Exhibit 2: Business Snapshot
Y/E March (` cr)
1QFY17 2QFY17 3QFY17 4QFY17 1QFY18 2QFY18 3QFY18 4QFY18
%YoY %QoQ
Business
Sanctions
8,801
8,437
9,459
13,149
10,863
14,201
16,552
24,300
85
47
Disbursements
6,215
6,609
7,059
8,700
8,237
9,950
10,846
15,770
81
45
AUM
71,940
75,223
78,296
83,560
88,236
93,995
1,01,286
1,11,090
33
10
Borrowing Mix (%)
Banks
52
44
42
42
44
43
41
42
DCM
32
43
42
42
39
40
41
40
FD
9
8
9
8
9
9
10
11
Mutilateral Agencies
5
4
4
4
4
4
4
3
NHB
2
1
4
4
4
4
4
3
Loan Mix (%)
Retail home loans
72
70
69
66
66
64
63
61
LAP
16
16
16
17
17
18
18
20
Builder
10
12
13
14
15
15
15
15
SME
3
3
3
3
3
3
4
4
Retail home loans
51,489
52,807
53,946
54,982
57,795
59,935
63,810
67,765
23
6
LAP
11,522
11,810
12,214
14,122
14,647
16,748
18,231
22,218
57
22
Builder
7,057
8,651
9,787
11,698
12,971
14,207
15,193
16,664
42
10
SME
1,872
1,956
2,349
2,757
2,824
3,105
4,051
4,444
61
10
Source: Company
May 10, 2018
2
DHFL | Q4FY2018 Result Update
Balance Sheet Statement
Y/E March (` cr)
FY16
FY17
FY18
FY19E
FY20E
Share Capital
292
313
314
314
314
Reserve & Surplus
4,600
7,683
8,482
9,753
11,317
Net Worth
4,892
7,996
8,796
10,067
11,630
Borrowings
51,556
71,023
79,027
1,01,154
1,27,454
- Growth (%)
27.3
37.8
11.3
28.0
26.0
Other Liabilities & Provisions
11,405
13,280
19,750
20,036
26,842
Total Liabilities
67,853
92,298
1,07,572
1,31,257
1,65,927
Cash & Bank Balance
3,408
3,430
2,468
2,518
2,568
Investments
893
13,535
8,077
3,679
4,288
Advances
61,775
72,096
91,932
1,19,512
1,52,975
- Growth (%)
21.0
16.7
27.5
30.0
28.0
Fixed Assets
781
843
979
1,021
1,115
Other Assets
996
2,394
4,117
4,528
4,981
Total Assets
67,853
92,298
1,07,572
1,31,257
1,65,927
- Growth (%)
24.2
36.0
16.5
22.0
26.4
Standalone Income Statement
Y/E March (` cr)
FY16
FY17
FY18
FY19E
FY20E
Net Interest Income
1,481
1,859
2,460
3,114
3,789
- YoY Growth (%)
17.8
25.5
32.4
26.6
21.7
Other Income
329
345
441
507
603
- YoY Growth (%)
24.0
4.7
27.8
15.0
18.9
Operating Income
1,810
2,204
2,901
3,621
4,392
- YoY Growth (%)
18.9
21.8
31.7
24.8
21.3
Operating Expenses
533
583
722
799
883
- YoY Growth (%)
12.4
9.5
23.9
10.7
10.5
Pre - Provision Profit
1,277
1,620
2,179
2,821
3,509
- YoY Growth (%)
21.9
26.9
34.5
29.5
24.4
Provision and Contingencies
175
218
420
486
627
- YoY Growth (%)
66.7
24.6
92.7
15.8
28.9
Profit Before Tax
1,102
1,402
1,759
2,335
2,882
- YoY Growth (%)
16.9
27.2
25.4
32.8
23.4
Provision for Taxation
373
475
584
771
951
- as a % of PBT
33.8
33.9
33.0
33.0
33.0
PAT
729
927
1,174
1,565
1,931
- YoY Growth (%)
17.4
27.1
26.7
33.2
23.4
Exception Item
-
1,969
-
-
-
Reported PAT
729
2,896
1,174
1,565
1,931
May 10, 2018
3
DHFL | Q4FY2018 Result Update
Key Ratio
Y/E March
FY16
FY17
FY18
FY19E
FY20E
Profitability ratios (%)
NIMs ( Calculated)
2.4
2.3
2.5
2.6
2.5
Cost to Income ratio
29.4
26.5
24.9
22.1
20.1
Cost to Asset ratio
0.9
0.7
0.7
0.7
0.6
ROA
1.3
1.3
1.3
1.4
1.4
ROE
15.3
14.4
14.0
16.6
17.8
CAR %
16.7
19.3
17.0
15.0
14.0
Asset Quality
Gross NPAs (%)
0.9
0.9
0.9
1.0
1.0
Net NPAs (%)
0.6
0.6
0.5
0.6
0.6
Credit Cost (%)
0.3
0.3
0.5
0.5
0.5
Provision coverage
38
38
38
37
40
Per Share Data (`)
EPS
25.0
29.6
37.4
49.9
61.6
BV
168
255
280
321
371
ABVPS
160
247
271
307
354
DPS
8.0
4.0
6.0
8.0
10.0
Valuation Ratios
PER (x)
25.2
21.3
16.8
12.6
10.2
P/BVPS (x)
3.8
2.5
2.2
2.0
1.7
P/ABVPS (x)
3.9
2.5
2.3
2.1
1.8
Dividend Yield
1.3
0.6
1.0
1.3
1.6
Dupont Analysis
Interest Income
11.4
10.6
10.0
10.4
10.5
Interest Expenses
9.0
8.3
7.6
7.8
7.9
NII
2.4
2.3
2.5
2.6
2.5
Other Income
0.5
0.4
0.4
0.4
0.4
Total Income
3.0
2.8
2.9
3.0
3.0
Operating Expenses
0.9
0.7
0.7
0.7
0.6
PPP
2.1
2.0
2.2
2.4
2.4
Provisions
0.3
0.3
0.4
0.4
0.4
PBT
1.8
1.8
1.8
2.0
1.9
Tax
0.6
0.6
0.6
0.6
0.6
ROA
1.2
1.2
1.2
1.3
1.3
Leverage
12.9
12.4
11.9
12.7
13.7
ROE
15.3
14.4
14.0
16.6
17.8
Source: Note - Valuation done on closing price of 07/05/2018
May 10, 2018
4